- India
- Jul 12
415 million Indians moved out of poverty in 15 years
• A total of 415 million people moved out of poverty in India within just 15 years from 2005-2006 to 2019-2021, the UN said.
• The latest update of the global Multidimensional Poverty Index (MPI) with estimates for 110 countries was released by the United Nations Development Programme (UNDP) and the Oxford Poverty and Human Development Initiative (OPHI) at the University of Oxford.
• The report demonstrates that poverty reduction is achievable. However, the lack of comprehensive data over the COVID-19 pandemic poses challenges in assessing immediate prospects.
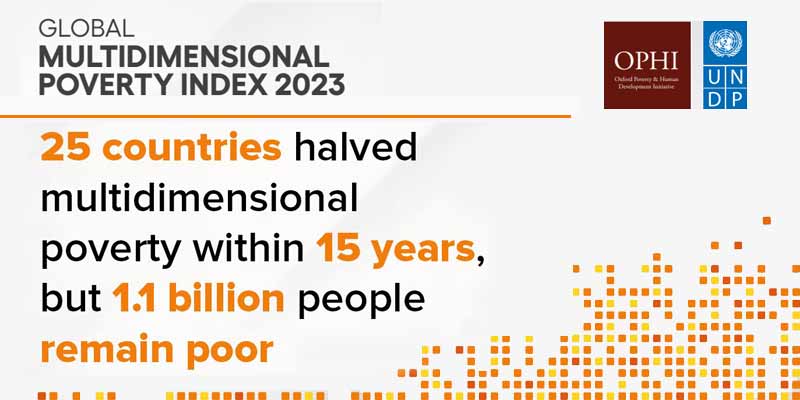
• It said that 25 countries, including India, successfully halved their global MPI values within 15 years.
What is Multidimensional Poverty Index?
• The global Multidimensional Poverty Index (MPI) both monitors poverty reduction and informs policy, showing how people experience poverty in different aspects of their daily lives – from access to education and health, to living standards such as housing, drinking water, sanitation, and electricity.
• First launched in 2010 by United Nations Development Programme (UNDP) and the Oxford Poverty and Human Development Initiative (OPHI), the global MPI advances SDG 1 — ending poverty in all its forms everywhere — and measures interconnected deprivations across indicators related to SDGs 1, 2, 3, 4, 6, 7 and 11.
• The global MPI is the only counting-based index that measures overlapping deprivations for more than 100 countries and 1,200 sub-national regions.
• The MPI sheds light on the complexity of poverty – where different indicators contribute to people’s experience of poverty differently, varying from region to sub-national region, and between and within communities.
• Ensuring that the data on global poverty is up-to-date and comprehensive is a crucial first step in addressing these challenges and maintaining progress towards a more equal world.
• The MPI as a poverty index can be pictured as a stacked tower of the interlinked deprivations experienced by poor individuals, with the aim of eliminating these deprivations.
• This report presents a compact update on the state of multidimensional poverty in the world.
• It compiles data from 110 developing countries covering 6.1 billion people, accounting for 92 per cent of the population in developing countries.
• It tells an important and persistent story about how prevalent poverty is in the world and provides insights into the lives of poor people, their deprivations and how intense their poverty is—to inform and accelerate efforts to end poverty in all its forms.
Key points of the Index:
• Understanding where poor people live is crucial for policymaking.
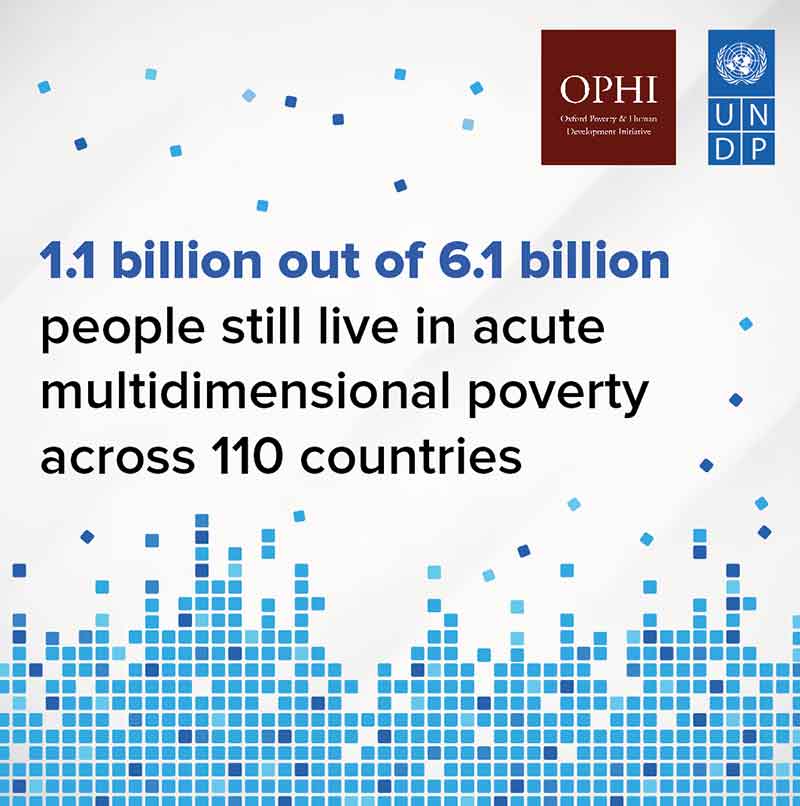
• According to the 2023 release, 1.1 billion out of 6.1 billion people (just over 18 per cent) live in acute multidimensional poverty across 110 countries.
• Sub-Saharan Africa (534 million) and South Asia (389 million) are home to approximately five out of every six poor people.
• Nearly two-thirds of all poor people (730 million people) live in middle-income countries, making action in these countries vital for reducing global poverty.
• Although low-income countries constitute only 10 per cent of the population included in the MPI, these are where 35 per cent of all poor people reside.
• Children under 18 years old account for half of MPI-poor people (566 million). The poverty rate among children is 27.7 per cent, while among adults it is 13.4 per cent.
• Some 54.1 per cent of poor children live in Sub-Saharan Africa, making poverty reduction for these 306 million children a vital focus for the region.
• Poverty predominantly affects rural areas, with 84 per cent of all poor people living in rural areas. Rural areas are poorer than urban areas across all regions of the world.
• Poverty disproportionately affects low-income countries. They are home to only 10 per cent of the population covered by the global MPI but 34.7 per cent (387 million) of poor people. Some 65.3 per cent of poor people (730 million) live in middle-income countries.
What deprivations do poor people experience?
To end poverty in all its forms, the interlinked deprivations that poor people experience need to be addressed to reduce the intensity of poverty and thereby empower poor people to exit poverty.
People living in multidimensional poverty ordinarily experience multiple deprivations simultaneously.
Breaking the global MPI down by indicator reveals which overlapping deprivations are the most widespread:
• Across 110 countries 824–991 million of the 1.1 billion poor people lack adequate sanitation, housing or cooking fuel. More than half of poor people are deprived in nutrition, electricity or years of schooling.
• The number of poor people deprived in nutrition is similar in South Asia and Sub-Saharan Africa (around 245 million).
• Almost 80 per cent of poor people who lack access to electricity — 444 million — live in Sub-Saharan Africa and are being left behind in an increasingly digital world.
• In all regions except Europe and Central Asia, around half of poor people live in a household where no member has completed six years of schooling, making this a vexing cross-regional issue.
What the report says about India?
• 415 million poor people moved out of poverty from 2005-2006 to 2019-2021.
• Incidence of poverty fell from 55.1 percent to 16.4 percent.
• Deprivation in all indicators declined.
• The poorest states and groups, including children and people in disadvantaged caste groups, had the fastest absolute progress.
• People who are multidimensionally poor and deprived under the nutrition indicator declined from 44.3 per cent in 2005-2006 to 11.8 per cent in 2019-2021.
• Child mortality fell from 4.5 per cent to 1.5 per cent.
• Those who are poor and deprived of cooking fuel fell from 52.9 per cent to 13.9 per cent.
• Those deprived of sanitation fell from 50.4 per cent in 2005-2006 to 11.3 per cent in 2019-2021.
• In the drinking water indicator, the percentage of people who are multidimensionally poor and deprived fell from 16.4 to 2.7 during the period, electricity (from 29 per cent to 2.1 per cent) and housing from 44.9 per cent to 13.6 per cent.
Manorama Yearbook app is now available on Google Play Store and iOS App Store


